Examples
Passing in an auth token
If the source higlass server requires authentication, an auth token can be passed in to the Authorization header of the request. To do this, the viewer needs to be instantiated as a widget with the contents of the authorization header passed in.
from higlass import view

v1 = view(...)
v1.widget(authToken=f"Bearer <my_token>")
Synchronizing location, zoom and value scales
To synchronize, the locations, zoom levels and value scales, use the provided
hg.lock to create a lock object and then register the given lock for the
visualization with hg.Viewconf.locks().
import higlass as hg

ts = hg.remote(
  uid='CQMd6V_cRw6iCI_-Unl3PQ',
  server="http://higlass.io/api/v1/",
)

# the entire viewport has a width of 12 so a width of 6 for
# each view means they take up half the width
view1 = hg.view(
    ts.track("chromosome-labels"),
    ts.track("heatmap"),
    width=6,
)

view2 = hg.view(
    ts.track("chromosome-labels"),
    ts.track("heatmap"),
    width=6,
)

lock = hg.lock(view1, view2)

(view1 | view2).locks(lock)
Multivec Files
To view multivec files, create the multivec and output file:
from clodius.multivec import create_multivec_multires

output_file = "/Users/pete/tmp/my_file.multires.hdf5"

create_multivec_multires(
    array,
    [('chr1', chrom_len)],
    agg=lambda x: np.nansum(x.T.reshape((x.shape[1], -1, 2)), axis=2).T,
    starting_resolution=1,
    row_infos = ["match", 'a', 'g', 't'],
    output_file=output_file,
    tile_size=256
)
Create the viewer. The horizontal-stacked-bar track is a plugin track so we have to pass in its url so higlass knows where to load it.
import higlass as hg

ts = multivec(output_file)
view = hg.view(
    hg.track("top-axis", height=20),
    ts.track("horizontal-stacked-bar", height=50,
        plugin_url="https://unpkg.com/higlass-multivec/dist/higlass-multivec"
    ),
)
view.domain(x=[0, 1000000])
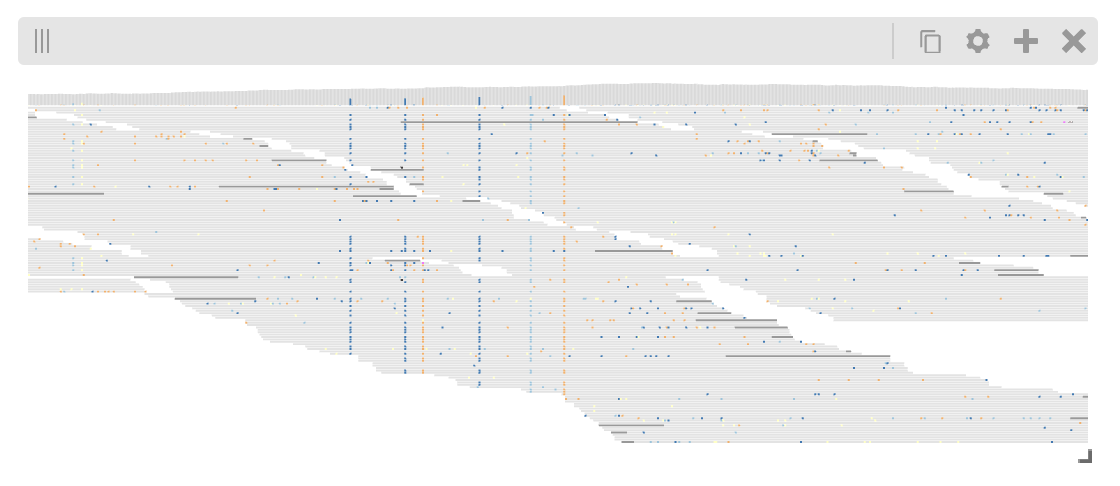
Pileup track
The higlass-python package also provides a way to include custom tracks in your view configuration. These tracks are defined in a separate (JavaScript) package, and can be included in Python in with some additional setup.
The PluginTrack provides a mechanism to hook into the schema validation
as well as provide the plugin source for the renderer. The plugin_url is a
special field which points to the JavaScript source code.
A plugin can be created by subclassing hg.PluginTrack and specifying the type
and plugin_url. For example,
from typing import Literal, ClassVar
import higlass as hg

class PileupTrack(hg.PluginTrack):
    type: Literal["pileup"] = "pileup"
    plugin_url: ClassVar[str] = "https://unpkg.com/higlass-pileup/dist/higlass-pileup.min.js"


# Specify the track-specific data
pileup_data = {
    "type": "bam",
    "url": "https://pkerp.s3.amazonaws.com/public/bamfile_test/SRR1770413.sorted.bam",
    "chromSizesUrl": "https://pkerp.s3.amazonaws.com/public/bamfile_test/GCF_000005845.2_ASM584v2_genomic.chrom.sizes",
    "options": {"maxTileWidth": 30000},
}

# Create and use the custom track
pileup_track = PileupTrack(data=pileup_data, height=180).opts(
    axisPositionHorizontal="right",
    axisLabelFormatting="normal",
    showCoverage=True,
    colorScale=[
        "#2c7bb6","#92c5de","#ffffbf","#fdae61","#808080", "#DCDCDC",
    ],
)

view = hg.view((pileup_track, "top")).domain(x = [1_636_200, 1_636_800])
view